Container Rates Today: Shipping Rates Chart and Prices (Updated October 2025)
If you had to place a PO by Friday, could you quote your CFO a container price today – and still trust it on Thursday? Rates move with blank sailings, holidays, and fuel. Quotes expire. Margins shrink in the time it takes to chase a revised slot. That’s the stress test every logistics leader lives with.
This guide helps you pass that test. In plain language, it shows how to read rate charts fast, spot the forces that move prices, and turn a quote into a landed cost you can defend. You’ll see where today’s market sits on the main trade lanes, how surcharges and local fees stack up, when FCL beats LCL, and what to do – right now – to cut spend without risking service.
If you run an enterprise supply chain or a scaling e‑commerce brand, the goal is simple: fewer surprises, better timing, and a freight plan that holds up when the market shifts. Let’s get you there.
Key Takeaways
- Container rates are stable but volatile. Prices have cooled from 2024 highs, averaging around $1,700–$2,000 per FEU, yet weekly GRIs and routing shifts still cause sharp swings—so always verify lane-specific quotes.
- Spot and contract rates have nearly aligned. With little gap between them, a blended approach—locking core volumes and leaving the rest flexible—gives better cost control and reliability.
- Fuel costs are easing, but new green rules add complexity. Lower bunker prices reduce BAFs, while the EU’s decarbonization measures are introducing long-term surcharges on Europe-bound trades.
- Total shipping cost goes beyond the base rate. Remember to factor in BAF, PSS, THC, inland legs, and demurrage/detention fees when budgeting your real “landed cost.”
- Smart planning beats last-minute bookings. Book early, use space efficiently (FCL over LCL after ~12–15 m³), and partner with a digital forwarder like Unicargo for real-time visibility, accurate budgeting, and fewer surprise costs.
Global Freight Rates Explained: What “container price” really means
When someone asks “what does a container cost today,” they’re usually talking about the ocean base rate to move one container between a port pair during a specific week. The base rate is quoted per FEU (40‑foot) or per TEU (20‑foot). Most indexes benchmark FEUs; some lanes still quote TEUs. Indices differ by method and cadence:
- WCI (Drewry) is a weekly assessment published on Thursdays that shows a composite plus lane‑level rates. It’s widely used by BCOs and forwarders as a neutral benchmark.
- FBX (Freightos Baltic Index) is the only daily IOSCO‑compliant container index, helpful when markets move quickly.
- Xeneta publishes spot and contract analytics based on large volumes of real bookings; their weekly snapshots are a good way to see current spot levels by trade.
Quotes you receive often read “all‑in,” but in practice they reflect a base ocean rate plus surcharges and local charges (more on those below). And there’s an important split between spot and contract pricing; roughly half of the market rides the spot tape, which matters when spot dips below your fixed deals.
The State of Global Freight Rates (late October 2025)
The short version: spot rates are well below 2024 peaks, with lanes bouncing on GRIs and seasonal demand, while underlying supply growth continues to pressure prices.
Here’s where the market sits this week:
- Far East → US West Coast: about $2,044/FEU on average spot.
- Far East → US East Coast: about $2,953/FEU.
- Far East → North Europe: about $1,976/FEU.
- Far East → Mediterranean: about $2,367/FEU.
(Weekly Xeneta snapshot, Oct 23, 2025.)
Freightos’ weekly update shows the same direction: Asia – USWC up 18% week‑over‑week to around $1,687/FEU, Asia – USEC near $3,071/FEU, Asia – N. Europe around $1,975/FEU. GRIs are doing some of the lifting.
Drewry’s composite WCI ticked up to $1,746/FEU on Oct 23, after a long decline earlier in Q3 – Q4.
Why the softness versus 2024? Two big forces:
- Supply growth outpacing demand. The container‑ship orderbook has hovered around 30%+ of the fleet this year; Linerlytica recently pegged it at ~31.7%, raising familiar overcapacity concerns.
- Cheaper fuel than 2022 – 2023 and stable bunker outlook. Global VLSFO averages sit near the $500/mt handle on Ship & Bunker’s G20 index, with forecasts that Q4 2025 averages around $493/mt. Lower bunker prints take pressure off BAFs.
Two route stories matter as well:
- Suez/Red Sea: Security risks continue to distort flows and insurance costs. Egypt’s Suez Canal Authority rolled out and later extended a 15% toll discount for large containerships (≥130,000 SCNT) to lure traffic back. It has helped, but the risk calculus still pushes some services around the Cape.
- Panama Canal: After 2024’s drought, water levels recovered and FY2025 transits jumped ~19% to 13,404, restoring much of the network’s reliability.
Put together, rates today look “lower but jumpy.” Carriers file GRIs to test the market; some stick, some don’t. And when spot undercuts older contracts, shippers regain leverage in tenders.
Breaking Down the Cost of a Container
Think of total cost as base ocean rate + surcharges + local port and paperwork + inland + insurance.
Fuel‑linked surcharges.
- BAF (Bunker Adjustment Factor) moves with bunker prices and is often updated quarterly. If VLSFO strengthens, BAFs follow.
- EBS (Emergency Bunker Surcharge) appears only when fuel spikes faster than BAF can track.
- LSF/LSS (Low Sulfur Fuel) may show up on some lanes as a separate line tied to IMO sulfur rules.
Currency exposure.
- CAF (Currency Adjustment Factor) offsets FX swings on certain trades. It may be a percentage applied to the base rate.
Seasonal and congestion exposure.
- PSS (Peak Season Surcharge) is common in the June – October retail build and before Lunar New Year.
Port and paperwork.
- THC / DTHC (Terminal Handling) cover lift, yard, and document work at origin and destination; they’re local, vary by port, and often surprise budgets if not modeled. In short, this charge is an aggregation of costs associated with the terminal provider’s property, and only applies to ocean freight.
Inland legs. Door moves add drayage, chassis, rail, or trucking. Free time, storage, and chassis splits can swing all‑in cost more than the ocean rate on short hauls.
Insurance. All‑risk cargo insurance for ocean shipments often runs ~0.3% – 0.5% of cargo value (commodity and risk dependent). War‑risk or high‑risk corridors can add extra.
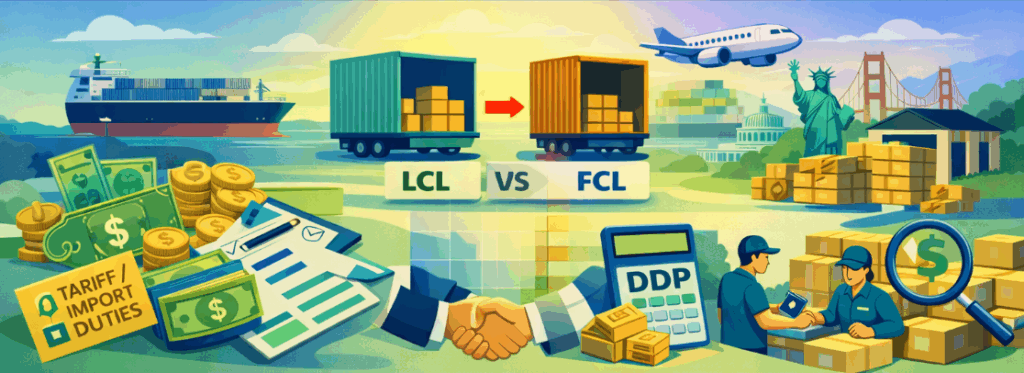
FCL vs LCL: which makes sense for your shipment?
Full‑container load (FCL) is a fixed price per box; less‑than‑container load (LCL) is priced per CBM plus handling at consolidation hubs. A helpful rule of thumb: when your shipment passes ~12 – 15 CBM, FCL often becomes cheaper on a per‑unit basis than LCL, especially once you factor local charges and time.
Capacity matters too. A standard 20′ holds about 33 CBM; a 40′ holds about 67 CBM.
Because a 40′ has double the space but typically costs only ~20 – 25% more than a 20′, it’s usually the better value if you can fill it.
How to Read Shipping Rate Charts
Charts will show a price per FEU or per TEU between two regions, updated daily (FBX) or weekly (WCI). They’re averages, so your quote may differ based on exact ports, equipment, free time, and service level. FBX is daily and regulated; WCI is weekly. Both are best read for direction and magnitude rather than penny accuracy.
Expect weekly fluctuation because carriers file General Rate Increases on set dates, and holidays shift both demand and capacity. Freightos’ weekly brief this week specifically attributes lane bumps to GRIs.
One more nuance: FEU prices are not twice TEU prices. In fact, market data shows the FEU – TEU price spread shifts with equipment balance and demand, but a FEU is often far less than 2× a TEU, which is why 40′ boxes are popular.
Key Trade Lanes & Why Prices Differ
Trans‑Pacific (Asia → North America). Demand is seasonal and retail‑heavy; chassis and rail bottlenecks can dominate the landed cost. Current spot sits near $2.0k – $3.0k/FEU depending on coast. Surcharges and free time policies at US ports are a big swing factor. (Xeneta)
Asia → Europe & Med. Suez/Red Sea risk and longer Cape routes distort transit and insurance. This month the Far East → N. Europe spot hovers near $1,976/FEU and Med near $2,367/FEU on Xeneta’s snapshot.
Trans‑Atlantic. More stable than TP in many seasons but sensitive to European demand and EU regulatory costs (ETS allowances began phasing in with the first surrender due by Sept 30, 2025 for 2024 emissions). Some carriers list ETS surcharges by lane.
Intra‑Asia and emerging trades. Short hauls, more frequent sailings, and heavy equipment repositioning keep rates quirky; local holidays and export policy shifts drive week‑to‑week changes.
Forecasting & Budgeting in a volatile market
Shippers who hit their budgets in 2025 did a few things well.
They watched capacity and orderbook math – because that sets the ceiling and floor. With the orderbook still elevated (~30%+ of fleet), oversupply keeps a lid on rates unless disruptions soak up capacity.
They tracked bunker and carbon costs. VLSFO trends near the $500/mt mark, and EU ETS and FuelEU Maritime are adding structural costs for voyages touching the EU. First ETS surrender was due Sept 30, 2025 (covering 40% of 2024 emissions), stepping up in coming years; FuelEU starts with a 2% GHG‑intensity reduction in 2025 and tightens over time.
They also watched reliability, because schedule slippage causes inventory and downstream costs. The new Gemini Cooperation network reported ~90%+ schedule reliability through the first half of 2025 on East‑West trades, well above recent industry averages – useful when you price buffer stock or safety days.
Contract or spot? In soft markets, spreading risk helps. Some teams lock a core volume at annual or multi‑month levels and leave the rest to spot, especially on lanes where GRIs fail to hold. If spot strengthens ahead of peak, you re‑weight. There’s no one right mix, but use index‑linked language cautiously; FEU/TEU spreads and accessorials can create basis risk if not written well.
Practical Ways to Reduce Freight Spend (without hurting service)
Start with utilization. If your shipments average more than ~12 – 15 CBM, shift LCL to FCL and consider upsizing from 20′ to 40′ where it fits – twice the space typically costs only about a quarter more. That simple change often lowers unit cost and damage risk.
Book earlier on tight lanes so GRIs and capacity squeezes don’t catch you at the last minute. On Trans‑Pacific, two‑ to three‑week lead times can be the difference between base rate and base‑plus‑PSS.
Design inland legs for free‑time discipline. Meter pickups so you don’t burn detention on chassis or demurrage at terminals; in the US, the FMC’s 2024 D&D rule set clearer billing timeframes and invoice details.
Optimize routes with live conditions in mind. If Suez risk rises, compare Cape routings plus insurance. If Panama’s booking rules change, review slot certainty and potential surcharges; the canal recently updated its long‑term slot allocation program for 2026, which affects planning.
Use predictive inventory and purchase‑order (PO) management to combine orders into fuller, less frequent boxes. Fewer boxes, better cube, lower unit cost.
Compliance, Delays, and Avoidable Penalties
Customs, safety filings, and terminal rules create hidden costs if you miss a step.
- For US ocean imports, the Importer Security Filing (ISF 10+2) is due no later than 24 hours before loading at the foreign port. Late or inaccurate filings risk penalties and delays.
- In the EU, ICS2 Release 3 is now in force across modes, adding house‑level ENS data and earlier submissions on maritime flows. If your EU filings aren’t ready, you risk holds.
- On demurrage and detention, most of the FMC’s billing rule took effect in 2024, with some exceptions.
Small misses here add up fast. Build checklists into your booking flow, and align responsibilities with your suppliers and forwarder so ISF/ENS data is complete and on time.
From Quote to Landed Cost: turning a rate into a budget number
A single ocean number doesn’t tell you what you’ll pay door‑to‑door. A simple landed‑cost workflow looks like this:
- Start with the base rate for the box and your known surcharges (BAF, PSS, CAF) for the week you plan to ship.
- Add local port costs at both ends (THC, documentation, security).
- Price the inland leg (dray + rail/truck + chassis).
- Estimate insurance at a realistic commodity rate (e.g., 0.3 – 0.5% for many general goods by ocean).
- Include duties, VAT/GST, and brokerage.
- Stress‑test with +/‑ 10 – 15% on the ocean leg and add a day or two of storage to see your risk band.
If you’re comparing LCL to FCL, translate both to cost per unit and add time as a cost: LCL’s extra handling can add days during peak and increase damage risk.
Need a quick way to test dimensions and chargeable weight? Use Unicargo’s volumetric & chargeable weight calculator to see if your current pack plan is pushing you into a higher chargeable tier.
Why Unicargo
You want predictable end‑to‑end cost, not just a cheap ocean number. Unicargo is a digital‑first freight forwarder that blends technology with hands‑on expertise so you get visibility, control, and speed without juggling multiple vendors.
Our platform gives you real‑time tracking and tailored workflows (from PO management to inventory views) and our operations team brings 24/7 customs clearance and exception management to keep freight moving. We back this with a global logistics ecosystem: international air and ocean, e‑commerce logistics, global warehousing, PO Management, trade & compliance, and reverse logistics.
If your team needs help turning a volatile market into a clear plan – cube optimization, lane design, budget modeling, or compliance guardrails – we’ll design a playbook for your volumes, SKUs, and delivery promise.
Ready to turn today’s rate noise into a durable plan? Let’s build a lane‑by‑lane budget, optimize your container mix, and set up a compliance playbook that protects your free time and cash flow. Talk to Unicargo or model your pack plans with our Volumetric & Chargeable Weight Calculator.
FAQs: quick answers for logistics decision‑makers
Why do rates change weekly? Carriers file GRIs on set dates; capacity (blank sailings, service changes) and holiday demand also shift the market. Benchmarks like WCI and FBX capture those moves; WCI weekly, FBX daily.
Can I lock a fixed rate? Yes – via contracts or named‑account deals – but use a portfolio approach so you don’t get stuck if spot drops. Many shippers hold a core contract volume and flex the rest to spot.
Are calculators reliable? They’re great for directional planning. Your actual invoice depends on equipment, free time, local charges, and compliance. Treat calculators as estimates, then validate with a forwarder.
Who pays freight – seller or buyer? It depends on your Incoterms. Under FOB, the buyer pays main carriage; under CFR/CIF, the seller pays freight to destination port (and insurance under CIF). Make sure your contracts match your budgeting model.