From Crisis to Calibration: Building a Resilient Supply Chain After Peak‑Season Storms
Peak seasons once felt like predictable spring tides. Today they resemble slow‑moving hurricanes: faculty capacity, port gridlock, erratic lead times, and warehouse floors that transform into makeshift storage yards. These “storms,” whether driven by extreme weather or a viral flash sale that goes too well, shine a harsh light on weaknesses that remain invisible during calmer quarters.
The real challenge is not avoiding every disruption – global trade will always be volatile – but converting each crisis into a blueprint for stronger performance. What follows is a “resilience retrofit”: a start‑to‑finish guide that shows logistics leaders how to turn last season’s chaos into next season’s competitive edge. We will move through five phases: post‑peak reality check, SWOT‑based diagnosis, design of backup systems, technology enablement, and cultural reinforcement. Along the way you will find concrete tactics, cost‑benefit pointers, and war‑room insights drawn from Unicargo’s work with manufacturers, retailers, and e‑commerce brands across five continents.
Key Takeaways
- Start with an audit, then redesign. A thorough, data-driven post-peak review captures critical chokepoints before insights fade.
- Engineer resilience, don’t just patch it. Mapping alternate lanes, setting dynamic safety buffers, and running digital simulations builds multiple paths to success and minimizes single points of failure.
- Leverage technology to shrink reaction times. Unified visibility, AI-driven forecasting, and automated compliance accelerate decision-making from days to minutes.
- Embed resilience in your culture. Cross-trained teams, resilience-centric KPIs, and proactive supplier collaboration turn lessons learned into organization-wide muscle memory.
- Partnering with Unicargo amplifies results. Our modern approach, digital platform, and decades of experience accelerate every step of your resilience retrofit.
The Post‑Peak Reality Check
1. Gather the Evidence While It Is Warm
The days immediately after a surge are pure gold. Staff still remember who stayed late to re‑label cartons, dashboards still contain raw latency data, and customers have not yet forgotten the pain of a late delivery. Block out a short “cool‑down week” in the corporate calendar – no new projects, no planning sessions, just honest reflection. Pull data from every node that handled volume: purchase‑order confirmations, carrier arrival logs, dock‑door scans, and ticket queues from customer service. Do not curate it yet; the goal is complete capture, not tidy reporting.
2. Hold a Story‑First Debrief
Facts without context rarely lead to action. Encourage each function to tell the story behind its datapoints. The warehouse team might explain that lines formed at inbound staging because the manifest spreadsheet still prints in order of purchase order, not container position. Customer service may reveal that the “bulk delay” email template actually confused consumers, generating more tickets than it solved. These color details often illuminate low‑tech fixes – like a simple re‑sort macro or a copy‑edit – that yield out‑sized gains.
3. Quantify the Customer Impact
While operational metrics are useful, customer exposure is the ultimate yard‑stick. Calculate how many orders breached their promised delivery date, how much revenue was deferred or lost, and how brand sentiment shifted in social‑media listening tools. When senior executives see that a single day of port congestion shaved two points off net‑promoter score, budget approvals for resilience initiatives tend to arrive faster.
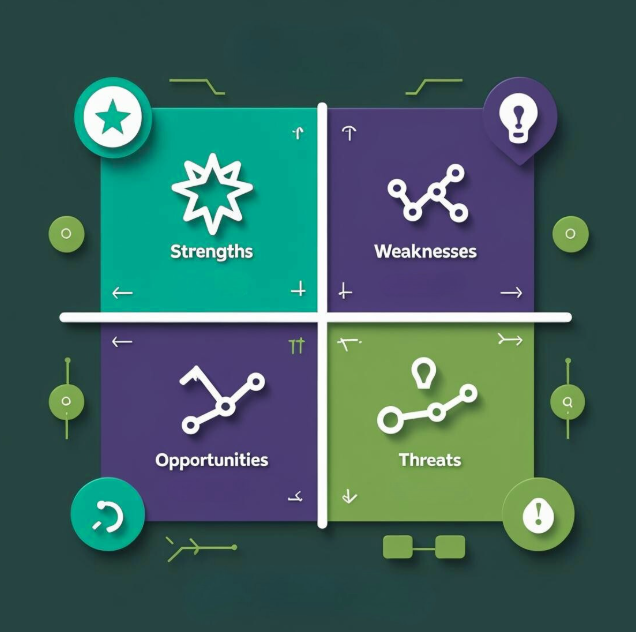
Conducting a Post‑Peak SWOT Audit
Strengths: Surface the Hidden Heroes
Not everything failed. Perhaps the Western European lane absorbed record volume with no schedule slip, or a mid‑tier supplier in Vietnam managed to expedite production during a typhoon that shut down its larger competitors. Identifying these bright spots does two things: it shows what to preserve in any redesign, and it turns unsung partners into reference models for others.
Weaknesses: Follow Each Delay to Its Root
A delay is seldom a single‑threaded problem. The two‑day lag on container 4178 might start with a missing certificate of origin, compound through an over‑booked feeder vessel, and end in a chassis shortage at the rail terminal. Trace each miss back through every hand‑off until you pinpoint the earliest detectable signal. Typically that signal was visible but ignored because alerts fired in email silos or legacy EDI(Electronic Data Interchange) reports that nobody checked after 6 p.m. local time.
Opportunities: Scan for Under‑Used Options
Look beyond your traditional lane‑and‑partner matrix. Could near‑shore co‑packers finish goods closer to demand, reducing stock‑out risk on promotional SKUs? Do any secondary airports have spare freight capacity coupled with shorter Customs wait times? Is there a local 3PL capable of handling reverse logistics so returns stop clogging mainline docks? Robust opportunities often hide in plain sight because they fall just outside last year’s RFP scope.
Threats: Bring in the Climate‑and‑Policy Lens
Disruptions are migrating. Flood risk is rising at Asian river‑delta factories; droughts are lowering water tables at key agro‑processing hubs; labor‑rights legislation is appearing in new jurisdictions. Plot these macro forces on the same map as your supplier network. A lane that looks solid on pure transit‑time data may be brittle once you layer on climate exposure or compliance volatility.
Designing the Retrofit: Backup Systems and Scalable Solutions
Having diagnosed the patient, it is time for the treatment plan. A retrofit is more than an insurance policy; done properly, it improves service and often lowers cost in steady‑state operations.
Alternate Lane Mapping – Building the Option Set
Start by expressing each end‑to‑end flow as a routing matrix rather than a single plan A. For instance, a Shenzhen‑to‑Chicago corridor might gain a plan B via Long Beach and rail, and a plan C via Lazaro Cárdenas and an intermodal bridge. Cost these alternates in normal and peak conditions, account for known choke points – like Panama Canal draft restrictions – and set automated triggers inside your TMS that propose the switch when transit‑time risk crosses a defined threshold. Advanced users feed live satellite AIS data into these triggers so port dwell jumps become visible before arrival.
Inventory Buffers – The Science of “Just‑in‑Case”
Excess stock ties up capital, but no‑stock risks lost sales. Move beyond a blunt “weeks of cover” metric. Instead, segment SKUs by two axes: gross‑margin contribution and demand volatility. High‑margin, high‑volatility items deserve thicker buffers because each lost sale hurts both revenue and brand loyalty. Conversely, low‑margin staples with stable demand can ride lean. Modern planning software linked into Unicargo’s platform can auto‑recalculate reorder points nightly as new point‑of‑sale data lands, shrinking obsolescence while guarding against surprise spikes.
Digital Simulation – Practicing Failure in Safety
Pilots train in simulators because a mistake at altitude is fatal. Supply‑chain leaders should do the same. Collect historical shipment data and live supplier‑performance scores, then script “shock events”: a typhoon shuts Shenzhen for three days, a rail strike idles Hamburg, or US CBP steps up exam rates for a new tariff code. Watch bottlenecks migrate, run cost estimations, and export the emergency routing plan directly to operations playbooks. Companies that drill twice a year cut re‑planning time during real crises by 40 percent on average.
Financial Guard‑Rails – Balancing Resilience and Cost
Retrofits cost money, so articulate the ROI early. Compare the carrying‑cost increase of adding five days of cover on your critical “A/X” SKUs with the revenue preserved by avoiding even a single stock‑out during Cyber Week. Model air‑freight as a contingent budget line, not an uncontrolled last resort. Finance leaders warm quickly to resilience spending when it is framed as margin protection rather than a speculative premium.
The Role of Technology in Future‑Proofing
Machine‑learning algorithms now digest hundreds of signals: search‑engine trend spikes, meteorological patterns, marketing calendars, and social‑media sentiment. Feeding these predictors into demand forecasts can shave error rates by double digits. The beauty of an adaptive model is that it warns planners weeks ahead when forecast error will widen, giving procurement time to widen inventory bands or expedite raw‑material replenishments before orders hit the factory floor.
Tariff codes change; documentation rules tighten. Manual workflows cannot keep pace and errors carry stiff penalties. A resilient automation workflow validates commercial invoices against rule libraries updated daily, auto‑flags dual‑use items, and pre‑populates country‑of‑origin certificates in the formats each authority demands. Faster clearance means lower demurrage, but the real win is certainty; knowing a customs block is statistically unlikely lets you cut day‑of‑cover without fearing a paperwork ambush.
The final technology layer is prescriptive alerting. Predictive ETA slips matter only if someone acts on them. When the system detects that a Westbound Trans‑Pacific vessel has slowed below schedule, it pushes a re‑routing recommendation – complete with alternate sailing schedules – to an ops queue. One click triggers the switch, a second click updates customer promise dates, and a third queues a proactive email. A resolution that once took 24 hours happens inside 15 minutes, dramatically reducing snowball effects downstream.
Building a Culture of Agility and Resilience
Cross‑Training and Elastic Teams: A warehouse is a living organism; when one area is overwhelmed, people must flow, not freeze. Cross‑train pickers on packing, inbound teams on returns, and supervisors on both. Rotation reduces fatigue, builds empathy, and creates a bench of multi‑skilled employees who can surge into bottlenecks without waiting for overtime approvals.
KPI Realignment – What Gets Measured Gets Managed: Traditional dashboards privilege cost per kilo or per pallet, but resilience has its own metrics: time‑to‑detect, time‑to‑reroute, buffer fill rates, and forecast‑error impact on service levels. Publish these alongside cost metrics so teams understand that saving five cents a carton at the expense of on‑time delivery is a false economy.
After‑Action Loops – Institutionalising Learning: Debriefs should not vanish into slide decks. Convert each lesson into a standard operating procedure, then push those SOPs into the TMS so the fix becomes workflow, not folklore. A discovery that expedited orders clog a specific door at peak becomes a routing rule that pre‑assigns them to a separate dock next season.
Supplier Collaboration – Extending Agility Upstream: Suppliers are often blamed for lateness but seldom given the forecasts they need to plan. Share weekly demand projections, alert them to promotion dates, and pass along the weather‑risk dashboards you use internally. When a typhoon path shifts, a factory that has your forecast can start weekend overtime before production slips, not after.
Why Unicargo Is a Strategic Ally in Resilience‑Building
Unicargo merges physical scale with digital technology. Our global offices and partner warehouses provide the literal space to divert flows when primary lanes jam. Our in‑house tech stack, built for real‑time granularity, gives customers a “single pane of truth” rather than a patchwork of carrier portals.
Beyond the hardware and software lies process expertise: we have helped apparel brands recover from Suez Canal closure reroutes, electronics makers mitigate semiconductor shortages with multimodal prioritisation, and health‑care distributors build temperature‑controlled last‑mile networks that survived record heatwaves. All that knowledge is embedded in our DNA – so clients do not just buy capacity; they buy foresight and care.
If you are ready to transform post‑peak pain into peak‑season performance, our specialists are a click away. Initiate your resilience retrofit here: https://www.unicargo.com/contact-us/.
Conclusion: Preparing for the Next Surge
Extreme weather, labor unrest, viral demand spikes – these forces will keep testing global supply chains. Companies that win will not be those with the deepest pockets or the flashiest software; they will be those that treat every disruption as a rehearsal for the next, harvest the data, redesign the system, drill the response, and measure success in hours saved and customers delighted. Follow the cycle outlined here – reality check, SWOT, retrofit, technology enablement, cultural reinforcement – and your supply chain will evolve from vulnerable to vigilant, from reactive to responsive. When the next storm approaches, you will not merely ride it out; you will use it to calibrate, strengthen, and surge ahead of competitors still bailing water.
Peak season will come again, as surely as tides. The question is whether your supply chain will float confidently on its improved buoyancy – or struggle in the undertow of its own unresolved gaps. With Unicargo as your logistics ally, the answer can tilt decisively toward confidence. Begin the journey today, and be ready not just for the next surge, but for the era of perpetual peaks now shaping global commerce.
Frequently Asked Questions
Q1. What exactly is a “resilience retrofit,” and how long does it take to implement? A resilience retrofit is a structured overhaul of your supply chain that starts with a post‑peak audit and ends with tested backup lanes, calibrated inventory buffers, and digital monitoring tools. Timelines vary, but most companies see meaningful changes within one to three months and a full program roll‑out in six to nine months.
Q2. How do I decide which SKUs deserve larger safety‑stock buffers? Segment inventory by both margin contribution and demand volatility. High‑margin items with unpredictable demand warrant thicker buffers, while low‑margin, stable sellers can stay lean. Modern planning software linked to real‑time sales data automates these calculations.
Q3. Does adding alternate lanes always increase cost? Not necessarily. While maintaining contingent contracts has a small premium, diversified routing often lowers average cost by reducing last‑minute expedites and demurrage. The goal is to balance routine efficiency with low‑cost optionality when disruptions strike.
Q4. How frequently should we run resilience drills? Industry leaders conduct tabletop exercises or system simulations at least twice a year—ideally before the main peak and shortly after it—so lessons feed directly into planning cycles.
Q5. What KPIs best measure supply‑chain resilience? Key metrics include time‑to‑detect (alert speed), time‑to‑reroute (response speed), buffer‑stock health, forecast‑error impact on service, and cost‑to‑recover. Tracking these alongside traditional cost and service KPIs keeps resilience visible.
Q6. How can Unicargo help if my company already has multiple 3PLs? Unicargo’s value lies in integration and foresight. Our digital platform aggregates data from all carriers and 3PLs into one live dashboard, while our global network and scenario‑testing platform offer contingency capacity and planning insight beyond individual providers’ silos.