Cross-Border Ecommerce Guide: How to Sell to the UK, EU, Canada, and Australia
The UK, EU, Canada, and Australia are some of the most familiar, ecommerce-mature destinations in the world – together they sit inside a global B2C cross-border market estimated at $1.21 trillion in 2025 and projected to reach $1.84 trillion by 2030. The market is real, it’s growing, and a clear majority of online shoppers – 59% globally – already buy from retailers outside their home country.
What makes it hard is the gap between “we ship there now” and “we make money shipping there”. That gap is filled with a hundred small operational decisions – about VAT, landed cost, payments, returns, and customs paperwork – that nobody warned you about. This guide is about closing that gap, market by market, before the surprise refund threads start. It also covers the two biggest regulatory shifts hitting cross-border sellers right now: the EU’s removal of the €150 customs duty exemption from July 2026, and the UK’s planned phase-out of its own £135 relief by 2029.
Key Takeaways
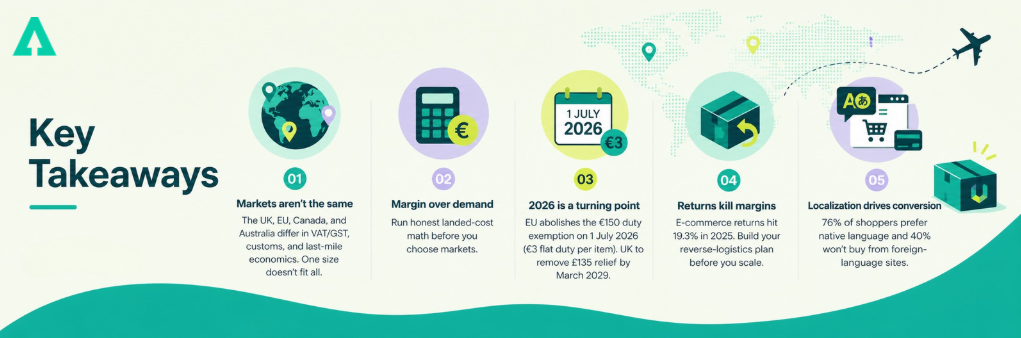
- The UK, EU, Canada, and Australia look similar from a marketing deck and behave very differently in operations. Each has its own VAT/GST scheme, customs treatment, and last-mile economics. Treating them as one motion is the most expensive mistake in cross-border.
- Margin, not demand, decides what to launch first. Run honest landed-cost math before you choose markets.
- Major 2026 change: From 1 July 2026, the EU is abolishing the €150 customs duty exemption. Low-value parcels get a flat €3 duty per item under an interim system. The UK has signalled it will remove its £135 relief by March 2029.
- Returns are the silent margin killer. E-commerce returns hit a 19.3% return rate in 2025. Build the reverse-logistics plan before launch, not after the second quarter of red ink.
- Localization beats translation. 76% of shoppers prefer to buy in their native language and 40% never buy from foreign-language sites. Currency, payment methods, and transparent duty handling move conversion more than catalog scale.
Who This Guide Is Actually For
If you’re a DTC brand staring at a Shopify Markets setup screen wondering which switches to flip, a marketplace seller eyeing Amazon FBA UK, Amazon.ca, or Amazon.com.au, or an operations lead who just inherited an “international expansion” line item that nobody else wants to own – this is for you.
It’s also for finance and compliance leaders being asked to sign off on a cross-border roadmap who want to know what they don’t know. The terminology assumes you understand ecommerce. The depth is calibrated for people who’ll actually have to make the decisions, not slide-deck readers. Where it helps to dig deeper into a subtopic, links to specialist guides will appear inline rather than sitting in a “further reading” graveyard at the bottom.
Why These Four Markets, and Why Not All At Once
Every cross-border list starts the same way, and there’s a reason. The UK, EU, Canada, and Australia consistently sit at the top because they share three traits: enough income to absorb premium pricing, deep familiarity with cross-border buying, and infrastructure mature enough that a parcel actually gets to a doorstep without being eaten by the void. The UK alone is now the third-largest ecommerce market globally, behind only China and the United States, with British shoppers averaging roughly £2,600 per person in annual online spend.
The trap is mistaking “all four are good” for “all four are equivalent.” The UK is its own ecosystem, separate from the EU, with its own VAT logic and customs paperwork. The EU is twenty-seven member states wearing the same passport. Canada is geographically convenient for U.S. brands but has provincial sales tax surprises that punish lazy pricing. Australia is far enough away that the freight bill alone can disqualify entire categories of product. Picking the right first market is largely about deciding which of those constraints you’re best built to absorb.
The UK: Familiar Storefront, Foreign Plumbing
For most U.S. brands, the UK is the friendliest port of entry. Same language, similar tastes, and an established appetite for buying from American retailers – in 2025, the United States supplied 38% of British cross-border orders, second only to China. The catch is that since Brexit, the UK runs on its own customs and tax system. The standard VAT rate is 20%, and below the £135 consignment threshold, non-UK sellers are typically required to register for UK VAT and collect at the point of sale. Every shipment also needs a GB EORI number for the importer, and “we’ll figure that out later” is a great way to get goods stuck at Felixstowe.
A regulatory shift to watch: the UK’s Autumn Budget 2025 confirmed the £135 customs duty relief will be abolished by March 2029 at the latest, with a public consultation running through 2026 to determine the exact mechanics. The £135 relief stays in place through at least the end of 2026, but cross-border sellers shipping low-value goods into the UK should start modeling a future where every parcel is potentially dutiable. The good news: because the UK is one country with one tax authority, the workflow stays cleaner than the EU’s. A focused launch with proper VAT registration, a Delivered Duty Paid checkout setup, and competent customs documentation is genuinely repeatable. We’ve broken down the practical mechanics – including EORI registration and how forwarders handle duty payment – in our dedicated guide to shipping from the US to the UK.
The EU: One Region, Many Operating Models – Now With New Customs Math
The EU is by far the largest single ecommerce region you can address from outside it, and 2026 is genuinely the most consequential year of regulatory change since the IOSS scheme launched. Two things to know:
First, the existing rules. Since July 2021, the Import One-Stop Shop scheme has let non-EU sellers collect VAT on goods up to €150 at checkout and remit through a single registration instead of country by country. That part isn’t going away.
Second, the change. On 12 December 2025, the European Council formally agreed to abolish the €150 customs duty exemption that has applied to low-value parcels for years. From 1 July 2026, an interim €3 flat-rate customs duty per item applies to low-value e-commerce shipments coming into the EU. The €3 duty is calculated per item (not per parcel), and the EU Council confirmed it will run as a transitional measure until a permanent regime arrives with the EU Customs Data Hub around 2028. IOSS still works for VAT collection – but VAT and customs duty are now both in play for low-value parcels, where previously only VAT was.
In practical terms: if your EU pricing model assumes “low value = no duty,” you need to update it before July. Multi-item consignments could carry multiple €3 charges. Sellers should also reconsider whether DAP (the customer pays import charges) or DDP (included in quotation) makes more sense as duty exposure increases on small parcels.
Beyond tax mechanics, the EU rewards sellers who localize properly. Country-by-country, Germany expects invoice-based payments and exact delivery windows. The Netherlands runs on iDEAL. France has its own carrier preferences. EU buyers also have statutory rights, including a 14-day right of withdrawal under the Consumer Rights Directive – your returns policy needs to reflect that or you’ll create both legal exposure and customer friction. Treating “the EU” as a single launch is how brands end up with a localized German store that converts beautifully and an Italian store that doesn’t, both running on a shared budget. Most successful EU launches start as one or two priority countries, not a regional blanket.
Canada and Australia: The Margin Markets
Canada and Australia get grouped because they share a profile – mature ecommerce, English-speaking (and bilingual in Canada), strong consumer comfort with U.S. retailers – and because each has a way of quietly punishing brands that don’t model the freight side carefully. Canada’s cross-border purchase rate is in fact the highest in North America at 55.5%; demand is rarely the issue.
Canada looks like the easiest cross-border market on the map for U.S. sellers. It’s right there. But the federal 5% GST is just the floor: provincial taxes layer on top, sometimes as a combined HST and sometimes as separate PST. Ontario’s HST is 13%; Nova Scotia’s HST dropped to 14% in April 2025; Quebec applies QST on top of GST for an effective rate around 14.975%; British Columbia layers 7% PST on top of the federal GST. Quebec adds bilingual labeling expectations. Alberta is the only territory with no provincial sales tax. Canadians are also remarkably allergic to surprise duty bills at the door, which makes Delivered Duty Paid checkout almost mandatory rather than optional.
Australia is the long-haul market. A 10% GST applies, and since 2018, GST has applied to low-value imported goods (AUD $1,000 or less) sold to Australian consumers, with the collection obligation falling on the seller, marketplace, or re-deliverer once they hit the AUD $75,000 annual turnover threshold. The bigger question isn’t tax; it’s whether your product can carry the freight cost from Los Angeles to Sydney without the contribution margin going negative. Heavy or bulky SKUs frequently can’t. Brands that win in Australia tend to lead with margin-rich, lightweight categories – supplements, beauty, accessories, premium apparel – and only graduate to heavier catalog after they’ve validated a local fulfillment model.
Pick the Market Before You Pick the Carrier
The most expensive cross-border mistake we see has nothing to do with shipping. It’s brands picking expansion markets the way they pick playlists: by what’s trending. Demand alone is a terrible filter. A good market combines real demand, defensible margin after all-in landed cost, manageable compliance overhead, and a customer experience you can actually deliver from where you are today.
When the marketing team brings a list of “demand signals from the UK and Germany,” the right next question is: what’s our contribution margin per order in each, after freight, duties, payment processing, and a realistic returns reserve? Most teams have never run that math because they’ve never been asked to. When they do, the priority order shifts – sometimes dramatically.
Demand Signals That Actually Mean Something
Before you spend on consumer research, mine the data you already own. International traffic that’s bouncing at checkout because shipping isn’t supported is a louder signal than a survey result. Marketplace data on the destination Amazon storefront tells you whether your category travels. Repeat-purchase rates on existing international orders – the ones that snuck through your domestic checkout – are gold; those customers liked the product enough to buy twice despite a friction-filled experience.
A skin-care brand we’ve worked with had been ignoring its Australian traffic, assuming it was a marginal market. But when they looked at twelve months of analytics, the picture was very different. Australian visitors had higher product-page engagement than UK users, and the biggest drop-off happened at the country selector and checkout.
That pattern isn’t unusual. Research from Baymard Institute shows that average cart abandonment sits around 70%, with nearly half of shoppers leaving because of unexpected costs at checkout.
The fix was straightforward but important: local AUD pricing, familiar payment methods, and GST included at checkout. Once those were in place, conversion improved quickly and the test paid back the setup costs within a couple of quarters. The demand was already there – it just needed a buying experience that made sense locally.
Landed Cost: The Spreadsheet That Changes the Roadmap
Landed cost is the discipline that separates serious cross-border operators from optimistic ones. It includes product cost, packaging, freight, duties, import taxes, last-mile delivery, payment processing, FX, and a returns reserve calibrated to actual return behavior in the destination market – not your domestic baseline.
Run honestly, this calculation has a habit of flipping the launch order. Take a $35 retail apparel SKU with a $9 product cost. In the U.S., the math works comfortably. Ship the same SKU to Australia and you might add $13 in international freight and last-mile delivery, $3.50 in GST, payment processing slightly higher than domestic because of cross-border fees, plus a returns reserve that has to account for the reality that an apparel return from Sydney costs more than the original profit on the sale. Suddenly the contribution that looked healthy at home is barely break-even before any marketing spend. That’s not Australia being a “bad” market – it’s Australia being a market for a different SKU mix.
This is the test the U.S. International Trade Administration’s exporter guidance has long emphasized: model total delivered cost before pricing for foreign markets. Revenue opportunity and profitable opportunity are not synonyms. If your numbers won’t survive an honest landed-cost model, the most expensive thing you can do is launch anyway and wait for the international P&L to confirm what the spreadsheet would have told you for free.
Three Phases, In Order
- The brands that scale internationally almost always run the same playbook. Phase one is a single-market test – ninety days, shipping direct from existing infrastructure, measured against five clear bars: conversion, AOV, transit performance, return rate, and contribution margin per order. If any of those five fail, you fix or you stop. You don’t expand around the problem.
- Phase two is cluster expansion. UK first, then Ireland and a couple of EU priorities. Or Canada first, then Australia. The point of a cluster is to share operational learnings: documentation standards, customs partner relationships, support workflows, exception handling. Compounding returns on operational maturity, in plain English.
- Phase three is in-region infrastructure – local fulfillment, in-region warehousing, possibly a local importer-of-record arrangement. This unlocks better delivery promises, lower per-unit shipping cost, and local-feeling returns. It also adds fixed cost. Most brands shouldn’t get there until they have at least two quarters of stable, profitable Phase-2 volume and a SKU mix predictable enough to forecast.
The Economics Nobody Talks About Until Q2
Cross-border profitability lives at the intersection of pricing, taxes, freight, and returns. Get any one wrong and the others can’t compensate. The brands that scale tend to think about the customer offer – price, delivery promise, return policy – and the operational design behind it as one connected system, instead of four departments throwing decisions over walls.
International pricing isn’t domestic pricing translated by the day’s exchange rate. It’s a deliberate choice that absorbs FX volatility, local positioning, payment-processing differences, and the operational realities of getting a parcel from your warehouse to a doorstep 5,000 miles away. The cleanest way to do it is to anchor to local market expectations rather than reflexively converting from USD: UK shoppers expect prices ending in .99 GBP, EU buyers expect VAT-inclusive pricing on the product page, and Australian shoppers expect GST-inclusive pricing without a surprise at checkout. Build a 3–5% FX buffer into the math so you’re not renegotiating prices every time the dollar moves.
The other lever most brands miss is the delivery promise itself. Speed is overrated; predictability isn’t. A customer waiting eight days who was told it would take eight days will rate the experience higher than a customer waiting six days after being told it would take five. The economics back this up: brands that overpromise generate disproportionate WISMO (“where is my order”) tickets, refund requests, and chargebacks, each of which costs real money on top of the original sale. A conservative, accurate “delivered by” date almost always beats an aggressive one. Our breakdown of air freight versus ocean freight tradeoffs walks through how mode selection affects what you can realistically promise, and the same logic carries through to last-mile.
What Breaks First When You Cross a Border
Domestically, most ecommerce ops can absorb a sloppy product description or a slightly off declared value – nobody at the next county over inspects them. Internationally, those small data problems become customs holds, valuation disputes, and angry refund requests. Crossing borders doesn’t just add steps; it raises the cost of every existing imperfection.
The Document Problem
Customs delays almost always start as data problems. A vague product description, a wrong HS code, an inconsistent declared value, an unclear country of origin – any of these can pull a shipment into manual review and add days to delivery, or in worse cases trigger fines. The World Customs Organization’s Harmonized System sits at the foundation of global tariff classification, and getting your codes right at the right level of specificity is one of the highest-leverage data investments a cross-border operation can make.
In practice, every SKU you intend to ship internationally needs four data points owned and locked down: a customs-friendly product description (different from your marketing copy), an accurate HS code, a defensible declared-value methodology, and a documented country of origin. Those flow into commercial invoices, packing lists, and electronic customs filings. Get them right once and shipments move; get them wrong and you get to learn how customs broker fees scale per hold. The discipline matters more than ever heading into July 2026, when the EU’s new €3 duty regime will rely heavily on accurate per-item product classification at the tariff-code level. We dig into the practical mechanics in our overview of customs and compliance for cross-border importers, which is worth reading before your first international shipment, not after the third one gets stuck.
Direct Shipping Versus Local Stock
There’s no universally right answer to “should I pre-position inventory locally?” – only an answer that fits your volume, margin, and SKU stability. Direct-from-origin shipping has lower fixed cost, higher per-unit transit cost, and slower delivery. Local fulfillment from in-region warehousing has higher fixed cost, better unit economics, faster delivery, and easier returns. The tipping point isn’t a magic number, but a useful rule of thumb: when a market reliably produces enough demand to fill at least one full container per quarter and your bestseller list is stable enough to forecast, local stock starts to make economic sense. Below that, direct shipping with smart consolidation usually wins.
A hybrid approach often outperforms either extreme. Pre-position the predictable bestsellers locally for fast delivery and easy returns; ship the long tail direct from origin. The practical mechanics of choosing a fulfillment model come down to this kind of segmentation rather than picking a single approach for the whole catalog.
For sellers using marketplace fulfillment as part of the strategy – Amazon FBA in the destination market, for instance – the planning gets more specific. Each marketplace has its own routing requirements, prep standards, and inbound restrictions, and a domestic FBA process won’t translate cleanly to Amazon UK or Amazon.com.au. Our Amazon prep services page covers the labeling, packaging, and compliance requirements per region.
Returns: The Quiet Margin Killer
If we could put a single warning sign on the entrance to cross-border expansion, it would say: plan returns before launch. The math here is brutal and consistent. The National Retail Federation’s 2025 Retail Returns Landscape reports that U.S. retailers expect $849.9 billion in total returns in 2025, with an e-commerce return rate of 19.3% – meaningfully higher than the 15.8% overall retail rate. International returns generally run hotter than domestic, and they cost dramatically more per unit once you include reverse shipping, processing, and refund timing.
Customer expectations make this a strategy issue, not just an operations one. The same NRF research found that 82% of consumers consider free returns a major purchase factor (up from 76% the prior year), and 71% say they’re less likely to shop with a retailer again after a poor returns experience. Eighty percent will tell their friends about a bad one. So treating returns as a back-office cost center is, in practice, leaving conversion on the table at the front of the funnel.
Three options sellers typically consider. Return to origin is operationally simplest and the most expensive – you eat international return shipping. Local consolidation, where returns aggregate at an in-country partner and ship back in bulk (or get processed locally for resale), is more economical at moderate volume. Refund without return for low-value or hard-to-restock items is sometimes the right answer purely on math: it’s cheaper to refund and write off than to physically retrieve.
A real example from apparel: one brand expanding into Europe initially routed every return back to its New Jersey warehouse. On the surface, the launch looked fine, but once returns started coming in, the economics broke down. International return shipping and handling costs quickly ate into margin.
They switched to a Netherlands-based returns consolidator, where items could be collected, processed locally, and either restocked or bulk-shipped back. That change reduced per-return costs significantly, often into the single-digit dollar range at scale – and made European margins viable within one quarter.
This is a common turning point. Returns look manageable at low volume, but without a local or regional solution, they become one of the fastest ways to turn a healthy cross-border program unprofitable.
Compliance Snapshot, Market by Market
Every destination has its own tax and customs framework. Treat the summaries below as starting points, not legal advice – when in doubt, work with a qualified tax advisor or customs broker for your specific catalog.
Selling to the UK
The UK applies VAT at a 20% standard rate on most goods sold to UK consumers. Below the £135 consignment threshold, non-UK sellers are typically required to register for UK VAT and collect at checkout; above it, VAT and any duty are settled at import. A GB EORI number is non-negotiable for anyone acting as importer of record. The Autumn Budget 2025 confirmed the £135 customs duty relief is being phased out by March 2029, so cross-border sellers should expect the duty-free regime for low-value parcels to disappear in the latter half of the decade. The cleanest UK launches treat it as a standalone workflow rather than bolting it onto an EU process – the regulatory environments don’t share enough plumbing to make a unified approach worthwhile.
Selling to the EU
The EU runs on VAT with rates and registration thresholds that vary by country. The IOSS scheme, in place since July 2021, lets non-EU sellers register once and collect VAT centrally on goods up to €150; above €150, VAT and duty get settled at import.
The big shift is on the customs side. From 1 July 2026, the long-standing €150 duty-free exemption is being abolished, replaced by an interim flat rate of €3 in customs duty per item. The interim system runs until a permanent regime takes effect with the EU Customs Data Hub, expected around 2028. IOSS is unaffected for VAT – but cross-border sellers who built pricing assumptions around “low value = no duty” need to update them. Expect ripple effects on DDP versus DAP decisions, on margin in low-AOV catalogs, and on data-quality requirements at customs.
Selling to Canada
Canada applies a federal 5% GST, with several provinces adding PST or using a combined HST. The headline rates: Ontario’s HST is 13%, Nova Scotia’s dropped to 14% in April 2025, New Brunswick, Newfoundland and PEI sit at 15%, British Columbia layers 7% PST on top of the 5% GST, and Quebec runs its own QST at 9.975% alongside GST for an effective combined rate of 14.975%. Alberta and the territories charge GST only. The Canada Border Services Agency administers customs at import, and the Canada Revenue Agency handles GST/HST registration for non-resident sellers above defined thresholds. Three things distinguish a clean Canadian launch from a messy one: bilingual labeling readiness for Quebec, a transparent DDP checkout (Canadians strongly prefer not to be surprised by duty bills), and a carrier setup that doesn’t quietly bleed margin on remote-area surcharges.
Selling to Australia
Australia applies a 10% GST. Since 2018, GST has applied to low-value imports of AUD $1,000 or less sold to Australian consumers, with the collection obligation falling on the seller (or marketplace, or re-deliverer) once the AUD $75,000 turnover threshold is met. Above AUD $1,000, GST and any duty get collected at the border. Tax handling, though, isn’t usually what makes or breaks an Australian launch. Freight is. Long-haul ocean and air rates are real, and the SKUs that survive the math are typically lightweight, margin-rich, and not size-sensitive. Heavy categories often need in-region fulfillment to pencil at all.
Localization Wins More Than Translation Alone
Translating product copy is the easy part of localization, and it’s also where most launches stop. The harder – and far more impactful – work is operational localization: payments, currencies, policies, and support, all calibrated to what local buyers actually expect.
The data on language alone should be enough to make this a strategic priority. A landmark CSA Research study covering 8,709 consumers in 29 countries found that 76% of online shoppers prefer to buy products with information in their native language, and 40% will never buy from websites in other languages. The same research found that 75% are more likely to repurchase from a brand whose customer service is available in their language. If your EU storefront is in English-only, you’ve voluntarily capped your addressable market in roughly the same way as if you’d disabled half your payment methods.
Local-currency display is non-negotiable in modern cross-border ecommerce, but it’s only the entry ticket. UK shoppers default to debit cards and digital wallets, with Apple Pay and Google Pay carrying real share. German buyers still use SEPA direct debit and invoice-based payments at meaningful volume alongside cards. The Netherlands runs on iDEAL. Canadians lean on Interac and PayPal. Australians use cards, PayPal, and increasingly Afterpay and similar buy-now-pay-later services. Skip these and the 13% of shoppers who abandon carts because their preferred payment method isn’t available become your conversion ceiling on local traffic.
Localization extends past the product page into the post-purchase experience. Shipping policies, returns language, FAQs, and support hours all need to feel native to the destination. A U.S. brand running 9-to-5 ET support effectively offers no live coverage during the business day in the UK, EU, or Australia. The fix isn’t always a 24/7 support team; often it’s a tiered approach – strong localized self-service content for routine questions, plus a small, well-trained support team that handles escalations across regions and watches the time zones.
Where Cross-Border Programs Quietly Die
Most failed expansions don’t fail because the demand wasn’t there. They fail because the operating model wasn’t ready, and one of a familiar set of patterns took hold:
A brand turns on global shipping the moment international traffic looks promising, without modeling landed cost. Six months later the international P&L is underwater and nobody can pinpoint exactly why. Or the team assumes marketplace registration handles all tax obligations, and learns during a tax audit that several country-level filings were missed. Or someone signs off on a “let’s do all of Europe” rollout that ends up with three countries neglected, two chaotic, and zero optimized. Or product data that’s “good enough” domestically becomes the source of constant customs holds. Or no returns plan exists, and unmanaged returns flow back to the U.S. warehouse at a per-unit cost higher than the product margin – a bigger problem now that Gen Z shoppers average 7.7 online returns per year, more than any other generation.
The pattern that ties all of these together is treating cross-border as a marketing decision instead of an operational one. A useful diagnostic: if your international launch plan doesn’t have a named owner for VAT/GST registration, a documented returns path, and a landed-cost model that survives a finance team review, the launch isn’t ready. Sometimes the right answer is to wait and build the missing capability rather than launching and trying to fix it under pressure.
Some markets show strong demand and still belong further down the roadmap. Catalogs dominated by low-margin SKUs that can’t absorb international freight, products whose return rates run structurally high (fashion and footwear without solid sizing data are the classic case), oversized or heavy items where long-haul economics simply don’t work, regulated categories with tight import controls (cosmetics, food, supplements, certain electronics), or destinations where local payment readiness would require significant engineering investment. None of these is a permanent disqualifier – they’re signals to build the missing piece before pressing go.
The Pre-Launch Checklist Worth Actually Running
Most launch checklists are theater. Here’s a shorter one that correlates with launches that don’t blow up. Before flipping the switch on a new market, verify each:
You can defend the market choice on margin, not just demand. You have a per-SKU landed-cost model that includes freight, duties, taxes, packaging, payment processing, and returns reserve – and it has survived a finance review. Local-currency pricing reflects the destination’s anchoring conventions and includes an FX buffer. HS codes, descriptions, declared values, and country-of-origin data are accurate and consistent for every SKU you intend to ship. The fulfillment model – direct, local, or hybrid – matches both volume and SKU stability. The return path is documented end-to-end with a known per-return cost. The checkout shows local currency, supports the dominant local payment method, and either includes or transparently surfaces duties and taxes. The delivery promise displayed at checkout matches what the carrier mix can actually deliver. Someone is named as compliance owner for VAT/GST registrations and ongoing filings. And finally, you have dashboards that will surface conversion, transit time, exception rates, returns, and country-level margin from day one.
If you’re launching into the EU specifically and going live on or after 1 July 2026, add one more line: confirm your duty-handling logic – checkout, customs documentation, and accounting – accounts for the new €3 per-item charge under the interim regime.
What to Watch in the First Thirty Days
The first thirty days post-launch are the most valuable learning window you’ll get. Track conversion by market against your domestic baseline, but don’t react to the headline number alone – segment by traffic source and device, because the breakdowns often tell a different story than the average. Review delivery exceptions weekly: if one carrier route is consistently slow, you want to know in week two, not month three. Compare actual transit times to the promise displayed at checkout, and adjust either the promise or the carrier mix when they drift apart.
Audit returns reasons in detail. A return rate 30% above domestic isn’t necessarily a problem if the reasons are addressable – better sizing guides, sharper product photography, or clearer delivery messaging often close most of the gap inside two months. And re-evaluate your fulfillment model based on real demand, not the plan: if Phase 1 volumes are exceeding forecast, start modeling whether Phase 3 needs to be pulled forward.
Conclusion: Earn the Right to Scale
The cross-border ecommerce playbook isn’t as complicated as it might look, but it does require patience that most growth teams aren’t naturally inclined toward. Pick the right first market based on margin, not enthusiasm. Defend the unit economics with honest landed-cost modeling. Localize the experience past the product page into payments, policies, and support. Treat compliance and logistics as growth enablers rather than back-office line items. Run the first thirty days as a learning sprint, not a victory lap. Let the data – not the slide deck – decide where you go next.
The brands that win internationally are almost always the ones that started smaller and slower than their internal pressure wanted them to, then scaled aggressively once the model proved itself. The ones that don’t tend to be the ones that confused turning on global checkout with running a cross-border business.
Designing the Operating Model Underneath All of This
Most of what we’ve covered above is strategy. The harder part is the operating model that has to sit underneath it – the freight, customs, warehousing, and returns plumbing that determines whether the strategy actually shows up for the customer.
That’s where Unicargo lives. We design and run the logistics layer for cross-border ecommerce: ocean freight and air freight from origin, customs and compliance work that keeps shipments moving instead of stuck, warehousing and fulfillment positioned closer to the customer, Amazon prep and Walmart logistics for marketplace sellers, D2C fulfillment for brands shipping direct, reverse logistics for the returns problem most brands underestimate, and importer-of-record services for sellers entering markets where they don’t yet have a legal entity. Our offices on three continents mean someone is awake when something goes sideways at origin, in transit, or at destination, and our digital platform gives you the visibility to see it.
What we keep getting hired for, though, isn’t the individual services. It’s the design problem – helping a brand decide whether the UK or Canada belongs first on the roadmap, modeling whether Australian freight pencils for their specific catalog, walking through what the EU’s July 2026 customs change means for their pricing and DDP setup, and figuring out a returns design that doesn’t quietly erase the margin on the orders we just delivered. If that’s the conversation you’re trying to have right now, contacting our team is the right place to start.
FAQ
Do I need to register for VAT in the UK and EU separately?
In nearly all cases, yes. The UK left the EU’s VAT regime, so EU registration (including IOSS) doesn’t cover the UK. UK sellers typically need a separate UK VAT registration if they exceed the relevant thresholds or sell low-value goods directly to UK consumers, while EU sales above €150 follow standard country-level VAT rules and goods up to €150 can usually be handled through IOSS. A qualified tax advisor should validate your specific situation, especially if you’re using marketplaces that may already collect on your behalf in some scenarios.
What changes for EU sellers from 1 July 2026?
The €150 customs duty exemption for low-value imports is being abolished. Under the interim regime, low-value parcels coming into the EU from non-EU sellers will carry a flat €3 customs duty per item. IOSS is unaffected and continues to handle VAT collection up to €150. If your pricing model assumed “low value = no duty,” now is the time to update it – and to make sure your checkout, customs documentation, and accounting systems can handle the new charge cleanly. A permanent regime is expected with the EU Customs Data Hub around 2028.
Should I offer DDP or DDU at checkout?
For direct-to-consumer brands, DDP is almost always the right default. It converts better, generates fewer support tickets, and avoids the refused-delivery problem when a customer gets surprised by a duty bill at their door. DDP requires you to model duties and taxes accurately at checkout, which is real engineering work, but it pays back fast – particularly with 47% of cart abandonments driven by unexpected costs at checkout. DDU is more defensible for B2B transactions or higher-AOV orders where the buyer expects to handle import themselves and has the operational maturity to do it.
When should I move from direct cross-border shipping to local warehousing?
The deciding factor is sustained volume combined with SKU stability. As a rule of thumb: when a market consistently produces enough demand to fill at least one full container per quarter and your bestsellers are predictable enough to forecast accurately, in-region warehousing tends to improve unit economics, delivery promises, and returns handling enough to justify the fixed cost. Below that, direct cross-border shipping with smart consolidation is typically more cost-effective.
What’s the most underestimated cost in cross-border ecommerce?
Returns. With e-commerce return rates running at 19.3% in 2025 and consumer expectations around free, easy returns rising every year, treating returns as a small operational line item is one of the fastest ways to make an otherwise healthy international launch unprofitable. Building a real returns plan – local consolidation, refund-without-return for low-value items, or a managed reverse-logistics partnership – before launch is one of the highest-leverage moves you can make.
How long does a phased international rollout actually take?
A realistic timeline is roughly 90 days to validate Phase 1 (a single market), another quarter or two to expand into adjacent markets in Phase 2, and 6–18 months before considering Phase 3 (localized infrastructure). Compressing this aggressively is technically possible but tends to produce exactly the failure patterns covered earlier in this guide – weak data, missed compliance, and poor customer experience. In cross-border ecommerce, slower is usually faster.
Ready to quote your next shipment? Click below and let’s get this rolling 😉