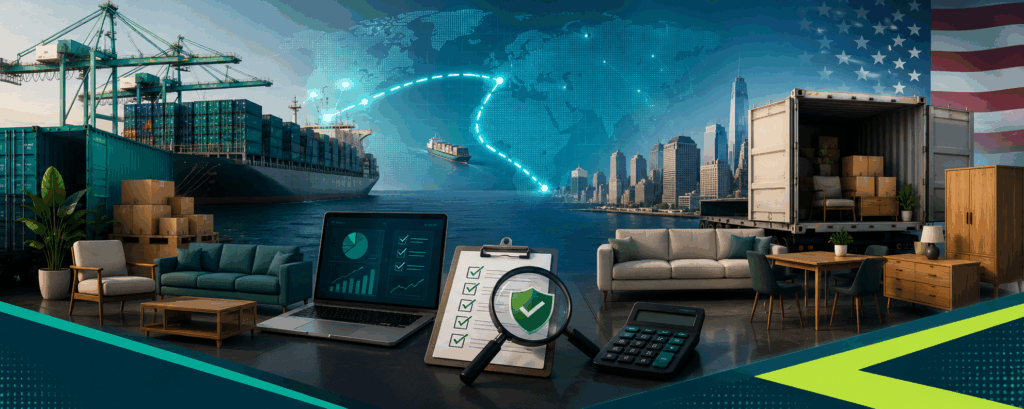
Mexico vs. Vietnam vs. India: A Landed Cost Comparison for U.S. Importers
For years, U.S. importers ran the same playbook: find the cheapest factory quote, ship it across the Pacific, and hope nothing went wrong in transit. That approach is breaking down. Tariff exposure, ocean freight volatility, longer reorder cycles, and concentrated supplier risk have forced buyers to look beyond unit cost. Today, a serious Mexico vs. Vietnam vs. India landed cost comparison is one of the most important exercises a U.S. importer can run before placing the next purchase order.
This guide breaks down how to think about total landed cost across these three sourcing options, where each country wins, where each falls short, and how to build a comparison framework that produces decisions you can defend a year from now.
Key Takeaways
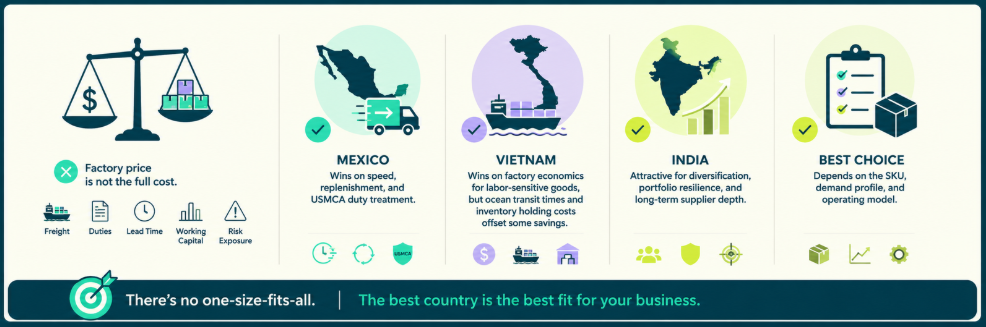
- A factory price comparison is not a sourcing decision. Real cost includes freight, duties, lead time, working capital, and risk exposure.
- Mexico tends to win on speed, replenishment frequency, and USMCA duty treatment for qualifying goods.
- Vietnam often wins on factory economics for labor-sensitive consumer goods, but ocean transit times and inventory holding costs offset some of those savings.
- India is increasingly attractive as a diversification play, especially for buyers seeking to build portfolio resilience and long-term supplier depth.
- The best country depends on the SKU, demand profile, and operating model, not on a country average.
Why this comparison matters more than ever
Sourcing strategy used to be a procurement question. Today it is a finance, operations, and risk question rolled into one. The cheapest factory in the world is no longer automatically the right choice when freight rates spike, ports congest, or new tariffs land mid-shipment.
U.S. trade flows have already shifted in response. According to the U.S. Census Bureau, Mexico has become the United States’ largest goods trading partner, while imports from Vietnam and India have grown sharply over the past decade as buyers diversify away from concentrated sourcing in China. The “China Plus One” strategy is no longer a buzzword – it is a budget line.
At the same time, U.S. tariffs on a wide range of Chinese imports remain elevated under Section 301 actions reviewed by the USTR, and successive administrations have layered additional duties onto categories ranging from electric vehicles to consumer electronics. The result is a sourcing environment where the country printed on a commercial invoice can swing landed cost by double-digit percentages.
The real question is not “Which country is cheapest?”
Headline labor cost rankings are misleading. A worker in Vietnam may earn less per hour than a worker in Mexico, but that comparison ignores everything else: freight, transit time, duty treatment, inventory carrying cost, exception handling, and the cost of being out of stock when a marketplace listing goes hot.
The right question is not “Which country is cheapest?” It is “Which country produces the lowest total business impact for this specific product, at this specific volume, under this specific demand pattern?” That framing changes the answer for almost every importer who runs the math honestly.
Start with landed cost, not FOB price
Before comparing countries, agree on what you are comparing. Most weak sourcing analyses fail because they stop at FOB factory price, then bolt on freight estimates as an afterthought. A useful comparison starts with a complete landed cost model.
A simplified landed cost formula looks like this:
Landed Cost = Product Cost + International Freight + Duties and Tariffs + Brokerage and Customs Fees + Inland Transportation + Insurance + Compliance Costs + Inventory Carrying Cost
Each of those lines moves differently depending on the origin country, mode of transport, and product classification. The same SKU can produce dramatically different real margins by origin once you model these variables consistently. That is why a quote from a Mexican factory and a quote from a Vietnamese factory should never be compared head-to-head as raw numbers. They are not the same thing.
What belongs in a true landed-cost model
A defensible landed-cost model captures every cost line a finished unit accumulates between the supplier’s loading dock and your customer’s order. At minimum, that includes:
- Product cost. Ex-works or FOB price from the supplier, including packaging.
- International freight. Ocean, air, or cross-border trucking and rail.
- Customs and clearance fees. Brokerage, entry filing, and any required documentation services.
- Duties and trade-program effects. Standard duty rates, Section 301 tariffs where applicable, and qualifying preferences under agreements like USMCA.
- Inland transportation. Drayage, LTL or FTL, and final-mile delivery to your warehouse or fulfillment center.
- Insurance. Cargo coverage during transit.
- Compliance costs. Testing, certifications, labeling, and any regulatory submissions required for the product category.
- Inventory carrying cost. Capital tied up in goods in transit and safety stock, plus storage and obsolescence risk.
- Exception costs. Inspections, rework, demurrage, detention, and chargebacks from retailers or marketplaces.
If your model only includes the first three lines, you are not running a landed cost comparison. You are running a partial cost comparison that hides the variables most likely to flip the answer.
The hidden costs buyers often miss
Even thorough buyers underestimate certain cost categories that disproportionately affect comparisons between near and far sourcing. These include stockout risk during demand spikes, forecast error penalties when long lead times force you to commit too early, MOQ pressure that ties up working capital, longer cash-conversion cycles that hurt smaller importers, split-shipment costs when partial orders ship to make a deadline, supplier onboarding time that eats months of lost output, engineering change delays when production runs are already scheduled, and quality remediation when remediation has to happen overseas instead of regionally.
None of these show up on a factory quote. All of them show up on the P&L.
Why lead time belongs in the cost equation
Lead time is not an inconvenience – it can be viewed as a marginal cost. Every additional week of transit and reorder time forces an importer to carry more safety stock, build longer forward forecasts, and tie up more working capital in goods that are not yet revenue.
Industry benchmarks from organizations like the Council of Supply Chain Management Professionals consistently show that inventory carrying costs in the United States typically run between 20% and 30% of the inventory’s value annually, once you include capital, storage, insurance, shrinkage, and obsolescence. Stretch lead times by 30 days, and you are effectively adding meaningful inventory carrying cost to every unit in motion. Faster replenishment from a regional source can reduce that drag, sometimes enough to flip the landed cost answer entirely on demand-volatile SKUs.
Mexico: when proximity changes the math
Mexico has become a serious competitor for U.S.-bound sourcing precisely because proximity changes the math in ways far-shore sourcing cannot match. According to the Office of the United States Trade Representative, bilateral goods trade between the U.S. and Mexico is the largest of any U.S. trading relationship, fueled by integrated supply chains under USMCA and growing nearshoring activity across automotive, electronics, medical devices, and consumer goods.
The appeal is not only geographical. It is the combination of shorter transit times, easier collaboration windows, deeper trade-program benefits, and the operational flexibility that comes from running supply chains within the same time zones as your demand market.
Freight, replenishment, and shorter planning cycles
A truckload moving from a maquiladora in Monterrey to a distribution center in Texas can clear in a fraction of the time required for an ocean container from Ho Chi Minh City. That difference compounds across the year. Importers can replenish more often, in smaller quantities, with less guesswork.
For a marketplace seller running on Amazon, Walmart, or Target, this matters. Faster reorder cycles mean smaller forecast errors, less dead stock, and the ability to react when a hero SKU starts trending. Long-haul ocean dependence works against the kind of tight cycle times that high-velocity e-commerce demands. Cross-border trucking and intermodal rail keep the planning loop short.
Where trade-program qualification can shift the decision
The big lever in Mexico’s favor is USMCA qualification. Goods that meet the agreement’s rules of origin can enter the United States duty-free. For categories already exposed to Section 301 tariffs from China, that gap can be enormous on a per-unit basis.
The catch is that USMCA benefits are not automatic. Each product must satisfy specific origin rules, often based on regional value content or tariff-shift criteria. That means buyers need to evaluate origin, bill of materials, and tariff classification carefully before assuming a duty advantage. Misqualification can trigger retroactive duty assessments and penalties from CBP. Done right, USMCA qualification can be the single biggest line on the landed cost comparison.
Product categories that may fit a Mexico strategy
Some product categories naturally suit Mexico more than others. Categories that benefit from a Mexico strategy typically share a few traits: they are sensitive to lead time, they have engineering or design specifications that benefit from supplier collaboration, they ship in volumes where regional replenishment makes sense, or they fall into segments like automotive components, appliances, medical devices, furniture, and certain electronics where Mexican manufacturing capacity is already deep.
According to research from McKinsey & Company, nearshoring activity has accelerated significantly in industries where responsiveness, quality control, and reduced supply chain length materially affect competitive positioning. The companies winning with Mexico are not the ones chasing the lowest unit cost. They are the ones designing for speed.
The tradeoffs buyers still need to test
Mexico is not a cheat code. Labor costs are higher than in much of Southeast Asia. Capacity is uneven by sector and region. Some industries, like apparel and footwear at scale, simply do not have the same depth of supplier base as Vietnam or Bangladesh. Border complexity at high-volume crossings can introduce unpredictable transit variability when CBP shifts inspection priorities.
The real question is whether the speed and trade-program benefits compensate for the higher unit price. For some products, they do it many times over. For others, they do not.
Vietnam: when offshore efficiency still outperforms nearshoring
For a category of goods where labor cost dominates the landed cost equation, Vietnam often beats Mexico cleanly on the math. Apparel, footwear, furniture, certain consumer electronics, and a wide range of light industrial products continue to source efficiently from Vietnam, and the country has emerged as one of the largest beneficiaries of supply chain diversification away from concentrated sourcing in China.
According to data from the U.S. Census Bureau, U.S. imports from Vietnam have grown several times over since 2010, making the country one of the largest sources of consumer goods entering the U.S. market.
Where Vietnam can be attractive on factory economics
Vietnam’s manufacturing strengths are real. The country offers competitive labor rates, an export-oriented manufacturing base, deep supplier ecosystems for textiles, footwear, furniture, and consumer electronics, and active foreign investment that continues to expand capacity year over year. The World Bank’s Vietnam country overview describes a manufacturing sector that has consistently expanded its share of global trade as multinational producers diversify their footprints.
For products where labor accounts for a large share of unit cost, the savings on factory price can be substantial enough to offset the longer freight times and higher inventory exposure that come with offshore sourcing.
The planning penalty of longer ocean-dependent supply chains
The cost of distance however is real. Ocean transit from major Vietnamese ports to U.S. West Coast destinations typically runs roughly three to four weeks, with another one to two weeks for inland transit and customs clearance. East Coast routings via the Panama Canal or Suez are longer and more exposed to disruptions.
That timeline forces longer reorder windows, larger safety stock buffers, and greater sensitivity to disruption. The Red Sea attacks in 2024, the Panama Canal drought conditions that reduced transit slots, and recurring port congestion on both U.S. coasts have all reminded importers that ocean lead times are not just long. They are volatile.
For high-velocity SKUs with unpredictable demand, that volatility can erase the factory-cost savings several times over. For steady-demand categories with strong forecast accuracy, the math still favors Vietnam more often than not.
India: when scale, capability, and supplier diversification justify the complexity
India is the most underweighted option in many U.S. importers’ sourcing strategies, and that is starting to change. The country’s manufacturing base has expanded materially in recent years, supported by government initiatives like Make in India and Production Linked Incentive (PLI) schemes that have drawn significant foreign direct investment into electronics, mobile phones, pharmaceuticals, and engineered goods.
For buyers thinking past the next shipment and toward portfolio resilience, India increasingly belongs in the conversation.
Categories and operating models that may suit India
India’s strengths show up in specific categories. Textiles, apparel, leather goods, jewelry, automotive components, generic pharmaceuticals, engineered industrial products, and increasingly mobile electronics are all areas where India has built genuine supplier depth. According to reporting from Reuters, the country’s manufacturing PMI has remained in expansion territory consistently, reflecting active capacity additions across export-oriented sectors.
The categories that fit India best are typically ones where buyers value supplier diversification, scalable production capacity, or specialized manufacturing capability that complements rather than duplicates Vietnam or China. India is rarely the obvious answer for a single SKU. It is often the right answer for a sourcing portfolio.
Where execution complexity can affect the final landed cost
The execution work in India is real. Supplier onboarding can take longer than in more standardized export economies. Documentation requirements demand careful handling on both ends. Logistics infrastructure varies meaningfully by corridor, with ports like Mundra and Nhava Sheva performing very differently from secondary gateways. Quality management requires more active engagement, particularly during the first several production runs with a new supplier.
These are not reasons to avoid India, instead, they are reasons to budget the internal resources and partner support needed to source effectively, then bake that effort into the landed cost model from the start.
Why India is often a strategic play, not just a price play
The strongest argument for sourcing from India is rarely the lowest quote on a single SKU. It is the strategic value of supplier diversification, optionality during disruption, dual-sourcing capability, and access to a manufacturing base whose long-term trajectory is one of the most positive in global trade.
Buyers who treat India purely as a price comparison usually walk away unimpressed. Buyers who treat India as a portfolio decision, with measured pilots and clear category bets, often find that the long-term value compounds in ways no spreadsheet captures on day one.
Comparing India and Vietnam without oversimplifying
The Vietnam-versus-India debate gets oversimplified constantly. Generic content claims one country is “cheaper” than the other, but that statement is meaningless without specifying SKU, volume, lead time tolerance, and target retail channel.
Vietnam tends to win on speed of supplier onboarding, integration with existing China-based supply chains, and depth of capacity in apparel, footwear, and furniture. India tends to win on textiles at high volume, leather, certain engineered goods, pharmaceuticals, and increasingly electronics where PLI incentives are reshaping landed economics. The honest answer for most categories is not “Vietnam beats India” or “India beats Vietnam.” It is “Run the SKU-level math under your own assumptions and decide.”
How to build a side-by-side comparison
This blog post can only frame the question. It’s your numbers that can answer it. The point of a Mexico vs. Vietnam vs. India landed cost comparison is to give you a structured way to compare the same product, under the same assumptions, across three different supply chain models.
A practical worksheet keeps the comparison honest. You only need three columns and a disciplined set of inputs to surface insights that no country-ranking article can produce.
Use the same assumptions across all three markets
The most common mistake in country comparisons is using different assumptions for each origin. One country gets compared at low volumes, another at high volumes. One uses ocean freight, another uses air. One assumes USMCA qualification, another does not. The result looks like analysis but produces nonsense.
To run a defensible comparison, lock the following criteriaacross all three countries:
- Order volume and SKU profile
- Incoterms (e.g., FOB origin port or EXW factory)
- Mode of transport relevant to each origin
- Duty treatment with realistic qualification assumptions
- Packaging specifications
- Target lead time and inventory days
- Quality and compliance requirements
Only then are the resulting landed cost numbers comparable.
Model three scenarios instead of one average case
A single point estimate is not a model. It is a guess with a decimal point. A useful comparison runs at least three scenarios per country: a steady-demand base case, a high-volatility case, and a disruption case where freight rates spike or transit times stretch.
The winning country often changes by scenario. Mexico might dominate the volatile-demand scenario because faster replenishment reduces stockout risk. Vietnam might dominate the steady-demand base case because factory economics carry the day. India might dominate the disruption case because supplier diversification reduces concentration risk. Reading those scenarios together produces a much smarter sourcing strategy than picking the single lowest number.
Include qualitative variables next to numeric costs
Some of the most important sourcing variables resist clean numbers. Supplier maturity, communication ease, engineering support quality, compliance readiness, and disruption sensitivity are real factors. They can be rated directionally, even if not modeled precisely, and they belong in the decision matrix alongside the numeric landed cost.
When each country makes the most sense
After running enough landed cost comparisons across enough categories, patterns emerge. None of these patterns are absolute. All of them are useful starting points before you run your own SKU-level numbers.
Choose Mexico when responsiveness matters more than the lowest nominal factory cost
Mexico is the strongest candidate when speed, replenishment frequency, and shorter planning windows materially affect margin or service levels. Categories with volatile demand, products that benefit from frequent reorder cycles, items requiring tighter quality oversight, and SKUs that qualify for USMCA duty treatment often produce the strongest landed cost outcomes from Mexico, even when the factory price is higher than Asian alternatives.
Choose Vietnam when lower production cost can absorb the distance
Vietnam is the right answer when factory economics dominate the cost equation and demand patterns are stable enough to absorb longer lead times. Apparel, footwear, furniture, and many consumer goods categories produce strong total landed cost outcomes from Vietnam, particularly when buyers can plan reorders confidently and run mature supplier relationships that minimize exception costs.
Choose India when diversification and long-term capability matter most
India is the strongest candidate when sourcing strategy extends beyond the next purchase order. Buyers looking to diversify their supply base, build category depth across textiles, leather, engineered goods, or electronics, and develop long-term supplier capability often find India produces the best strategic outcome, even when the short-term landed cost difference is modest. The value compounds through resilience, optionality, and capacity that pays off in future cycles.
Mistakes that make country comparisons unreliable
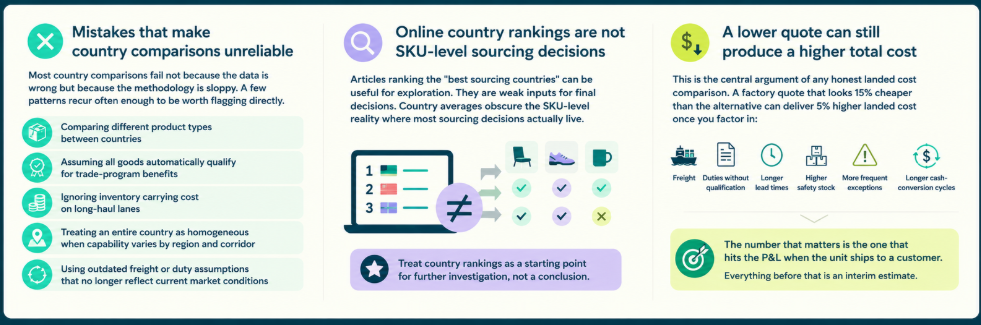
Most country comparisons fail not because the data is wrong but because the methodology is sloppy. A few patterns recur often enough to be worth flagging directly.
The biggest mistakes include comparing different product types between countries, assuming all goods automatically qualify for trade-program benefits, ignoring inventory carrying cost on long-haul lanes, treating an entire country as homogeneous when manufacturing capability varies dramatically by region and corridor, and using outdated freight or duty assumptions that no longer reflect current market conditions.
Online country rankings are not SKU-level sourcing decisions
Articles ranking the “best sourcing countries” can be useful for exploration. They are weak inputs for final decisions. Country averages obscure the SKU-level reality where most sourcing decisions actually live. The same country can be the cheapest option for one product and the most expensive for another, sitting on the next shelf.
Treat country rankings as a starting point for further investigation, not a conclusion.
A lower quote can still produce a higher total cost
This is the central argument of any honest landed cost comparison. A factory quote that looks 15% cheaper than the alternative can deliver 5% higher landed cost once you factor in freight, duties without qualification, longer lead times, higher safety stock, more frequent exceptions, and longer cash-conversion cycles.
The number that matters is the one that hits the P&L when the unit ships to a customer. Everything before that is an interim estimate.
How we help importers run real Mexico vs. Vietnam vs. India landed cost comparisons
At Unicargo, we work with U.S. importers every day on exactly this question, and we know how quickly a sourcing comparison can fall apart when the freight, customs, and warehousing assumptions are wrong. We built our business around the idea that a logistics partner should make the math easier, not harder.
We are part of Amazon’s Service Provider Network with our own teams across the United States,EMEA, and China, and we run ocean freight, air freight, cross-border trucking, and customs and compliance services in support of importers comparing Mexico, Vietnam, India, and other origins. Our digital platform gives buyers visibility into rates, transit times, and shipment status so the freight and duty inputs in your landed cost model reflect what is actually happening in the market this week, not what the spreadsheet assumed last quarter.
When clients need to model nearshoring scenarios, we help them understand realistic transit times and duty implications under USMCA. When they need to scale Vietnam volumes, we plan ocean strategies that reduce exposure to lane disruption. When they want to pilot India as a diversification source, we coordinate the documentation, port logistics, and customs clearance work that makes the first shipments succeed instead of stall.
If you are running a serious Mexico vs. Vietnam vs. India landed cost comparison and want a freight forwarding and logistics partner that can ground your numbers in real-world operations across all three corridors, our team is happy to walk through the model with you.
FAQ
Is Vietnam cheaper than India for U.S.-bound sourcing?
It depends entirely on the SKU, volume, duty treatment, freight mode, and lead-time assumptions. Vietnam often produces lower landed cost in categories like footwear, furniture, and certain consumer electronics where its supplier ecosystem is deep. India often wins on textiles at scale, leather goods, certain engineered products, and pharmaceuticals. Country-wide statements about which is “cheaper” almost always break down at the product level.
Is Mexico better than Vietnam for U.S. importers?
Better at what? For responsiveness, USMCA-qualifying categories, and products where speed materially affects margin or service levels, Mexico typically wins. For labor-intensive consumer goods with stable demand, Vietnam often produces better landed cost outcomes despite the longer freight lane. The right answer depends on the operating priorities of the importer and the demand profile of the SKU.
How accurate is a Mexico vs. Vietnam vs. India cost comparison online?
Generic online comparisons and country calculators are useful for exploration but unreliable as decision tools. They almost always rely on outdated freight rates, simplified duty assumptions, and country-average production costs that do not reflect the SKU you are actually sourcing. A reliable comparison requires product-specific assumptions, current trade conditions, and corridor-level logistics inputs.
Do USMCA benefits apply automatically to goods made in Mexico?
No. Goods must satisfy specific USMCA rules of origin to qualify for preferential duty treatment. That generally requires meeting either a tariff-shift rule or a regional value content threshold, depending on the product category. Buyers should validate qualification with their customs broker before assuming a duty advantage.
How long does it typically take to onboard a new supplier in Vietnam or India?
Onboarding timelines vary significantly by category and supplier maturity. In Vietnam, established export-oriented suppliers can often run a first production batch within two to three months of contracting. In India, the timeline can stretch longer, particularly for buyers new to the market or working in categories with heavier compliance and quality requirements. Plan for at least one to two production cycles of supplier development before treating any new source as primary.
Working on the next shipment? Let our team get you the best quote (click below).